-
Meaning of "Disk Reads" Values in DBA_HIST_SQLSTAT
This blog post was originally released on Pythian blog
This post relates to my previous writing on mining the AWR. I noticed that it’s very easy to misinterpret the DISK_READS_TOTAL and DISK_READS_DELTA columns in DBA_HIST_SQLSTAT. Let’s see what the documentation says:
- DISK_READS_TOTAL - Cumulative number of disk reads for this child cursor
- DISK_READS_DELTA - Delta number of disk reads for this child cursor
You might think it’s clear enough and that’s exactly what I thought too. The number of disk reads is the number of IO requests to the storage. But is it really true?
-
There's Always Another Bug Hiding Just Around the Corner
This blog post was originally released on Pythian blog
We were using a 10.2.0.3 database, and it had been running without any issues for several years. What could possibly go wrong? Anything! Suddenly, we started getting
ORA-07445: exception encountered: core dump [qercoStart()+156] [SIGSEGV] [Address not mapped to object]a few times a minute in the alert log. A closer investigation revealed that one of the popular SQLs in the application couldn’t complete anymore. It looked like a bug, since only the SQL was failing. -
Be Warned: cmclean.sql is Dangerous!
This blog post was originally released on Pythian blog
I’m sure one of the most popular scripts for Apps DBAs on My Oracle Support is
cmclean.sqlfrom MOS Article ID 134007.1 “Concurrent Processing - CMCLEAN.SQL - Non Destructive Script to Clean Concurrent Manager Tables”. DBAs usually use the script to clean up stale data from concurrent processing tables (FND_CONCURRENT_%) after incidents like a crash of the database or concurrent processing node. This script sets correct completion phase and status codes for terminated concurrent requests and sets correct control codes for terminated concurrent manager processes. Despite the assuring “Non Destructive” claim in the title of the MOS Article there is a possibility to lose concurrent request schedules whencmclean.sqlis executed. -
Performance Settings of Concurrent Managers
This blog post was originally released on Pythian blog
This is the second article in a series about internals and performance of concurrent managers. In this post, we’ll take a look at three important settings that affect the performance of the concurrent managers: number of processes, “sleep seconds”, and “cache size”. This article might be a bit on the theoretical side, but it should provide a good understanding of how these settings actually affect the behavior and performance of concurrent managers. Most of the statements in this article build off of information from my previous post: The Internal Workflow of e-Business Suite Concurrent Manager Process. It may be helpful to take a look at it before continuing with this one.
Life cycle of a Concurrent Request
The interesting thing about tuning concurrent managers is the fact that we don’t tune a particular query or a running process, but we actually tune the pending time of concurrent requests. The goal of the tuning is to make sure concurrent requests start executing soon enough after the time they have been scheduled for. Let’s take a look at the life cycle of a concurrent request:
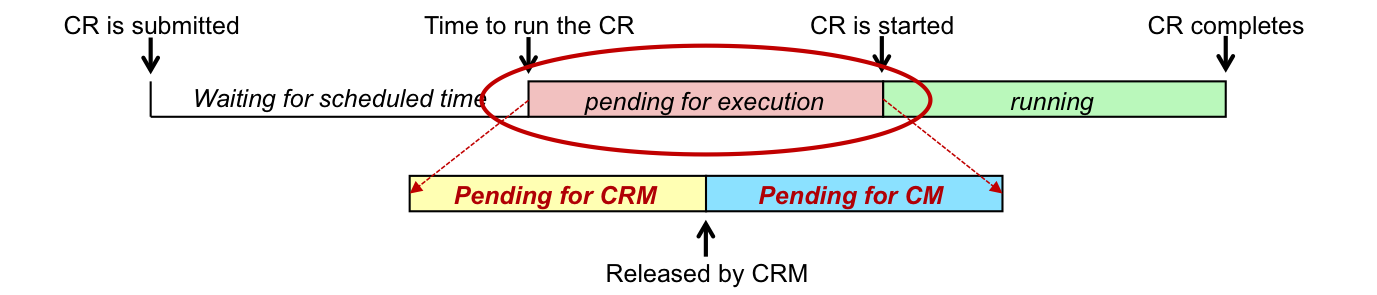
The Life cycle of a Concurrent Request (CR)
Based on the diagram above, the pending time of the request is the interval between the time the request was scheduled to start and the time it actually started. This time can be split in two parts:
- Pending for Conflict Resolution Manager (CRM) - Here the CRM checks the incompatibility rules effective for the pending concurrent request against other running requests. The CRM allows the request to execute only when all incompatible requests have completed.
- Pending for Concurrent Manager (CM) - This is the time spent waiting for an available concurrent manager process. It also includes the time the CM process takes to fetch the request from FND_CONCURRENT_REQUESTS table and to start executing it. “Pending for CM” is the interval that can be tuned by altering the number of manager processes, “sleep seconds” and the “cache size” settings.
-
Which Partitions Does The SQL Statement Access?
This blog post was originally released on Pythian blog.
This is a short blog post on how one can prove that a particular partition of the table or index is accessed by a specific query.
The solution to this question seemed interesting enough to share with you all. Here’s a short description of what I had:
- A SQL with sql_id =
9kuvj1g38hja2is the TOP 1 statement in “User I/O” section of AWR report. - The statement queries data from multiple tables. One of them is a fairly large table named “ALERT”. It is range partitioned by date, and each year has it’s own partition (Y2013, Y2012, …).
- The SQL takes 5 – 10 seconds to complete and is executed 500 – 5000 times each hour (sometimes even ~10 of them are running simultaneously).
- ~95% of elapsed time is spent on db file sequential reads.
- Diagnostic pack is licensed (it is required for this method as ASH is used).
We also had a statement so that none of the queries should be reading data older then 1 year, but looking at the statistics I suspected there was something wrong. So here’s how I found out older data from the ALERT table was accessed:
- As the query is executed very often, it has many appearances in ASH.
- As the statement does lots of db file sequential reads, there are many p1 (file_id) and p2 (block_id) combinations available from ASH.
- file_id and block_id can be joined to DBA_EXTENTS to find out the segment which the block belongs to. That is where the partition names being accessed by the SQL where found out.
The challenge with this approach was the fact that I had more then 100K samples for
9kuvj1g38hja2waiting on db file sequential reads in DBA_HIST_ACTIVE_SESS_HISTORY, and there were millions of extents in the database. How do I join them efficiently? I can fetch only the segments we’re interested in from DBA_EXTENTS before joining it all to DBA_HIST_ACTIVE_SESS_HISTORY (Thanks Yury for this great hint)! So this is the query that solved the mystery:with exts as (select /*+ materialize */ partition_name, file_id, block_id, blocks from dba_extents where owner='SECRET' and segment_name='ALERT'), stats as (select /*+ materialize */ p1, p2, count(*) cnt from DBA_HIST_ACTIVE_SESS_HISTORY where sql_id='9kuvj1g38hja2' and event='db file sequential read' group by p1, p2) select partition_name, sum(s.cnt) read_count from exts e, stats s where e.file_id=s.p1 and s.p2 between e.block_id and e.block_id+e.blocks-1 group by partition_name order by 2;It’s short and simple, and it also answered the question I asked. Is old data accessed by the SQL statement? Yes.
PARTITION_NAME                 READ_COUNT
------------------------------ ----------
Y2006                                 111
Y2007                                5645
Y2008                                5698
Y2013                               10388
Y2009                               13473
Y2010                               21600
Y2011                               37186
Y2012                               56184

 8 rows selected
Be careful when interpreting the results! If the SQL does not report a partition as being accessed, it doesn’t mean it was not accessed. ASH is based on sampling – maybe we got “lucky” and samples didn’t cover reads from that partition? Maybe all blocks belonging to the partition were in buffer cache and no reads were needed? But, if the SQL reported a partition as being accessed, we can be 100% sure it really was, and for me that was enough.
- A SQL with sql_id =