Do AWR Reports Show the Whole Picture?
AWR report is a great source of aggregated information on top activities happening in our databases. I use data collected in AWR quite often, and obviously the easiest way of getting the data out from the AWR is by running the AWR report. In most cases that’s not an issue, but there are certain scenarios when it hides the information one is looking for, just because of how it’s designed.
If I’m trying to collect information about top queries by physical reads, I would normally look at the “SQL ordered by Reads” section and this is what I’d see:
I have the top SQLs by physical reads – just what I’ve been looking for (except the fact that AWR report covers only one of my RAC nodes).
But wait a second, what if there are queries that don’t use bind variables? This might be a problem as each query would have it’s own SQL_ID and probably they wouldn’t make it into the TOP10 just because each of them is treated separately. Nothing to worry about – AWR also collects FORCE_MATCHING_SIGNATURE values (read this blog post to understand why I know they would help) and we can use them to identify and group “similar” statements, we just need a custom script to do that.
Here I use my custom script to report TOP 20 SQL_IDs by physical reads in last 7 days (and I’m reporting data from both RAC nodes in the same list) – you can see the few TOP SQLs are the same as reported in AWR report, but because I’m reporting database-wide statistics instead of instance-wide as AWR does, I have other SQLs on the list too. I’ve also included 2 additional columns:
- DIFF_PLANS – number of different PLAN_HASH_VALUE values reported for this SQL_ID, and if only one is found – it shows the actual PLAN_HASH_VALUE
- DIFF_FMS – number of different FORCE_MATCHING_SIGNATURE values reported for this SQL_ID, and if only one is found – it shows the actual FORCE_MATCHING_SIGNATURE
Now, I can adjust the custom script to aggregate the data by FORCE_MATCHING_SIGNATURE, instead of SQL_ID. I’ll still keep the DIFF_PLANS column and will add a new one – DIFF_SQLID.
The situation is a little bit different now. Notice how the second row reports FORCE_MATCHING_SIGNATURE = 0, this typically shows PL/SQL blocks that execute the SQL statements and aggregate statistics from them, so we’re not interested in them. Otherwise the original report by SQL_ID showed quite accurate data in this situation and my suspicions regarding the misuse of literal values where binds should be used, didn’t materialize. Could I be missing anything else? Yes — even the FORCE_MATCHING_SIGNATURE could be misleading in identification of TOP resource consumers, you can write two completely different SQLs (i.e. select * from dual a and select * from dual b) that will do the same thing and will use the same execution plan. Let’s query the top consumers by PLAN_HASH_VALUE to check this theory!
I’ve highlighted the third row as the same PLAN_HASH_VALUE is reported for 20 different SQL_IDs, which allowed it to take the third place in the TOP list by physical reads (actually it’s the second place as PLAN_HASH_VALUE=0 is ignorable). The next query expands the third row:
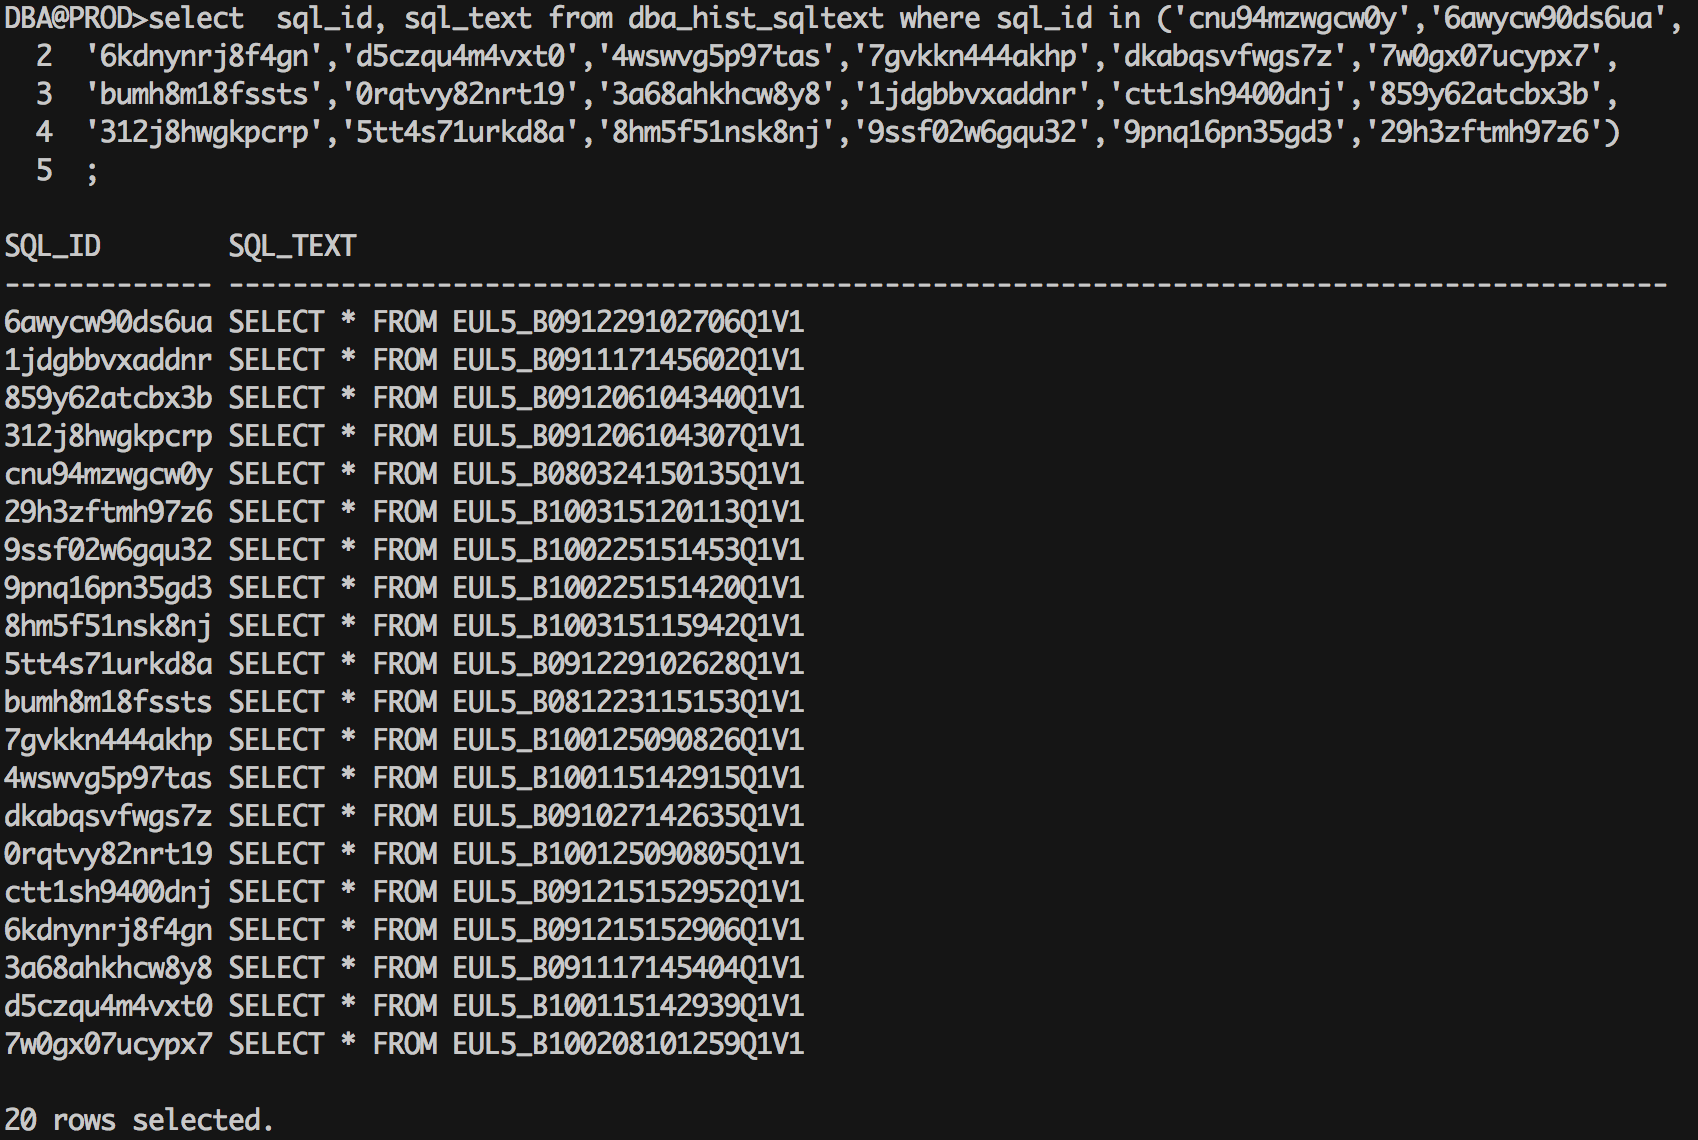
And here are All the SQL statements:
What I have here is 20 different views generated by Oracle Discoverer that query the database by using exactly the same execution plan. Closer look revealed the views included hardcoded query parameters (date intervals for reporting), but in the end, this was the same query! It’s the TOP2 query by physical reads. in the database and if I tune it – all 20 discoverer views will benefit.
I think one of the drawbacks of AWR reports is that it is not able to identify such situations, it would be great if user could choose the column by which he aggregation is done. In the situation I described I was able to identify one of the top queries by physical reads only when I aggregated data by PLAN_HASH_VALUE.


