Tracing a single concurrent request
What do you do when you need to trace a concurrent request for troubleshooting or performance tuning purposes? Here we take a look at some most obvious methods and one which I found the most convenient in many cases.
There are some well-known methods I used to use most often:
- The easiest one - “catch” the DB session while it’s executing and enable trace manually with
DBMS_SESSION.START_TRACE_IN_SESSION,DBMS_MONITOR.SESSION_TRACE_ENABLEor other command you like best; - Enable tracing for the concurrent program using “Enable Trace” option in System Administrator responsibility -> Concurrent -> Program -> Define form.
However, there are some drawbacks to these methods: You may not be quick enough to enable the tracing manually or you won’t see the statements that were executed just after start of concurrent request as tracing was not yet enabled at the moment. Or, you will not get the information of waitevents and binds in the trace file if you use “Enable trace” option.
How to avoid these drawbacks? There’s a profile option “SQL Statement - Custom”, set it to a value: BEGIN FND_CTL.FND_SESS_CTL('','', '', 'TRUE','','ALTER SESSION SET TRACEFILE_IDENTIFIER='||''''||'USERID' ||''''||' EVENTS ='||''''||' 10046 TRACE NAME CONTEXT FOREVER, LEVEL 12 '||''''); END; and you’ll get a trace file with all the waitevents and binds for all the user sessions. The statement can be adjusted to your needs, but remember - the profile option value field is just 240 characters long. But here’s another problem - all the user sessions are traced including self service, forms, scheduled CRs and submitted CR’s. You may end up with hundreds of trace files struggling to find the needed one.
As I later found out, there is a nice profile option Concurrent: Allow Debugging, which allows enabling of debugging/tracing levels just for a particular concurrent request upon submission. You can set it to Yes and instruct the user to submit the request once again and use the button “Debug Options”…
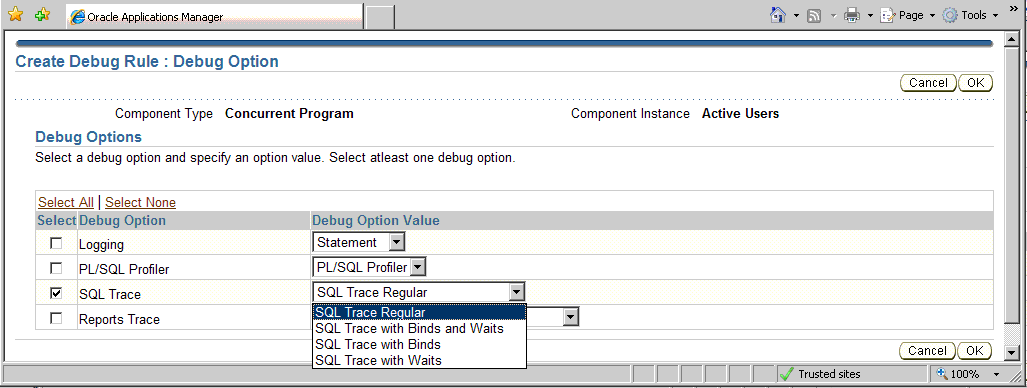
… and then choosing the desired tracing options…
… save your choice and that’s it, you’ll get a single trace file with a name {sid}_ora_{eBS_User}_CR{request_id}.trc in your DB udump directory.

